If you are considering changing solder pastes, then a solder paste evaluation should be run to compare and contrast solder paste performance. Solder paste evaluations can be quickly requiring minimal line time. Quantitative data is generated which allows solder paste performance to be measured. A solder paste evaluation is a good way to choose the best solder paste for your process.
A solder paste evaluation starts with the selection of the solder pastes to be tested. It is common to choose multiple solder pastes of the same type for an evaluation. The current or standard solder paste should be run as a baseline for comparison to the other solder pastes.
If the intent of the evaluation is to qualify a new type of solder paste, then it is highly recommended to run two or more solder pastes for comparison.
Once the solder pastes are chosen, then the methods used for solder paste evaluation need to be considered. The methods should be challenging to show the strengths and weaknesses of each solder paste. In some cases, certain defects occur with the standard solder paste and reducing these defects is of key importance.
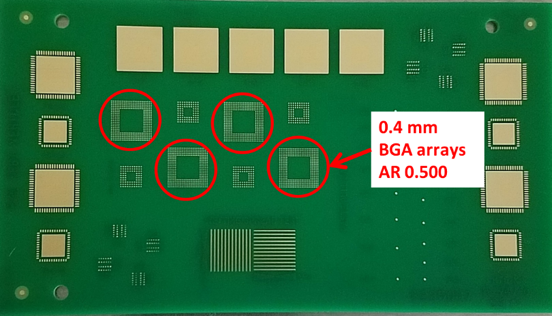
Figure 1: Print and Reflow Test Board
The methods selected for solder paste evaluation should measure these defects whenever possible. Here is a brief overview of various methods used for solder paste evaluation.
Solder paste print performance can be measured through a variety of methods. It is best to use a circuit board with small stencil aperture area ratios (<0.66) in order to challenge today’s solder pastes. See Figure 1 with a print and reflow test board with 0.4mm pitch BGA arrays and 0.50 AR stencil apertures.
Printed solder paste volumes are measured and the mean and standard deviation are compared for each solder paste.
Solder pastes which give high volumes and lower standard deviations are generally considered better for printing, especially for fine pitch components.
Bridging performance can be measured through the use of specially designed bridging patterns (Figure 2).
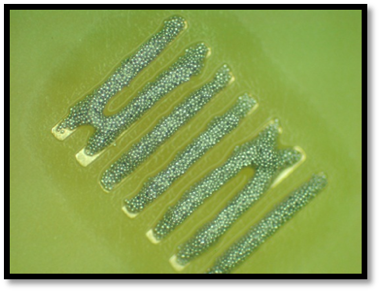
Figure 2: Bridging Pattern
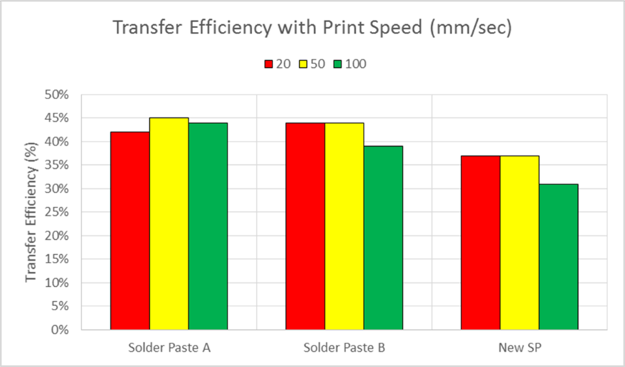
Figure 3: Transfer Efficiency Variation
Low bridging potential is a desirable trait for a solder paste.
These print tests can be run with a range of print speeds. Some solder pastes do not print well at higher print speeds, therefore higher print speeds can be used to differentiate between solder paste print performance (Figure 3).
Stencil life and response to pause on the printer are important characteristics of solder paste. Some solder pastes respond well to pauses in printing while others do not.
Some solder pastes also work well over long periods of time on the stencil. A test to measure this involves printing the solder paste through small area ratio apertures (<0.66) over a period of time with pauses of increasing length.
Solder paste volume is measured and changes in mean volume and standard deviation after each pause are evaluated (Figure 4).
Typically, an 8-hour print and pause test will show differences in solder paste performance.
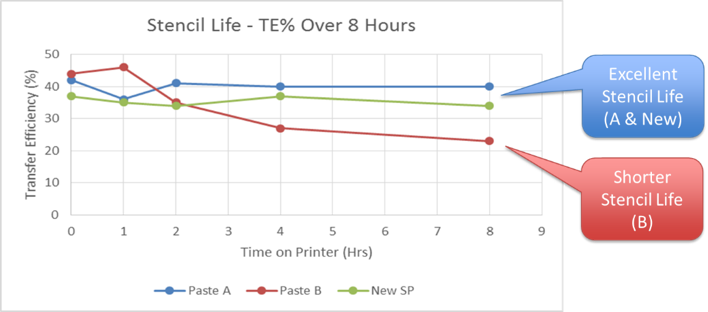
Figure 4: Print & Pause Data for 3 Solder Pastes
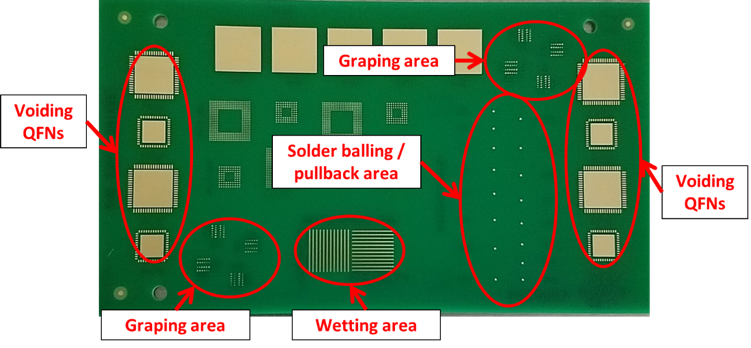
Figure 5: Wetting, Solder Balling, Graping & Voiding Reflow Test Patterns
For example, in Figure 4 solder paste A and a New solder paste maintain consistent transfer efficiency over the 8-hour print and pause test while solder paste B does not. This test can be extended to 12 or 24 hours if an 8-hour test does not show differences between solder pastes.
Reflow performance of a solder paste is equally important as print performance. Reflow performance is best measured through the use of specially designed patterns on a circuit board.
Wetting or spread, solder balling (random), graping, and voiding can all be measured and quantitative data gathered very quickly (Figure 5).
Have a question about solder paste evaluation?
Reflow performance should also be run on the standard surface finishes used. Some solder pastes work better with certain surface finishes than others (Figure 6).
These reflow characteristics can also be measured in conjunction with the stencil life test to determine what happens to reflow performance over time as the solder paste sits on the stencil.
Some solder pastes are very stable and show good reflow performance throughout the open time. Other solder pastes are not as stable and reflow performance suffers over time.
Reflow performance should be measured using reflow profiles which are representative of those used for normal production.
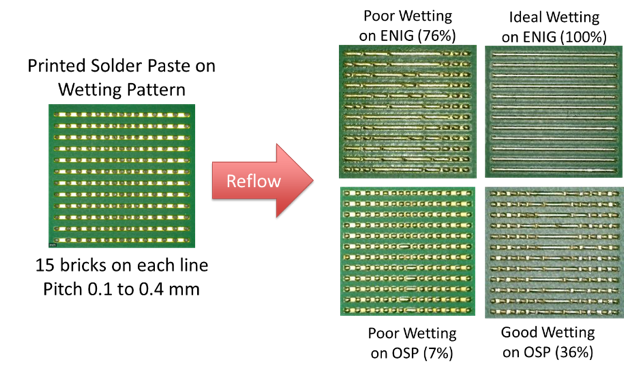
Figure 6: Reflow Wetting Performance on ENIG Versus OSP Surfaces
All solder pastes should be run through the same reflow profile in order to minimize variation.
Doing so allows for more accurate comparison of solder paste performance.
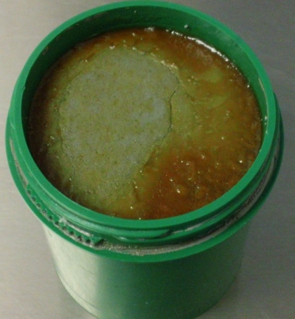
Figure 7: Solder Paste After Heat Aging 45°C (113°F) For 3 Days
There are a variety of other ways to challenge solder pastes. Solder paste stability can be evaluated by heating or aggressively mixing the solder paste for a period of time. Heating solder pastes in a sealed container to 40 or 50 °C for several days is a way of simulating potential shipping issues.
For example, when a solder paste is held at a shipping warehouse over a summer holiday or long weekend, then it may be exposed to 40 or 50 °C for several days. Is the solder paste still usable after this (Figure 7)?
Some solder pastes are very stable and will tolerate this type of temperature excursion. After heating, the solder pastes should be evaluated for print and reflow performance using the methods described above.
Another method of testing solder paste stability is mixing solder paste continuously open to the air. This can be done on the printer with a blank stencil using a knead cycle. Continuous mixing should be done for 6 to 8 hours, during which time the air oxidizes the solder powder and the flux reacts with the metal oxides in a continuous cycle.
This typically causes a thickening of the solder paste and loss of activity which affects both print and reflow performance. Some solder pastes are very stable and tolerate continuous mixing very well. After continuous mixing, the solder pastes should be evaluated for print and reflow performance using the methods described above.
Washability of the flux residue is a common concern for solder paste users.
Water soluble solder pastes are not all truly soluble in water but are instead washable in water (Figure 8).
Water washability tests should be performed on water soluble solder pastes after multiple reflow cycles.
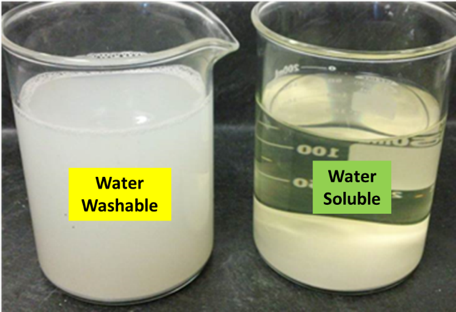
Figure 8: Water Washability & Solubility of Solder Paste Flux
If the process includes removal of no clean flux residues then testing should be run using the normal wash process after multiple reflow cycles.
Some solder paste flux residues are easier to remove than others.
When certain defects are of concern, then the solder pastes should be run on circuit boards which commonly show those defects. Solder paste performance can be compared with regards to the specific defects. These tests should be run based on the best recommendations from each solder paste supplier in order to mitigate the defects.
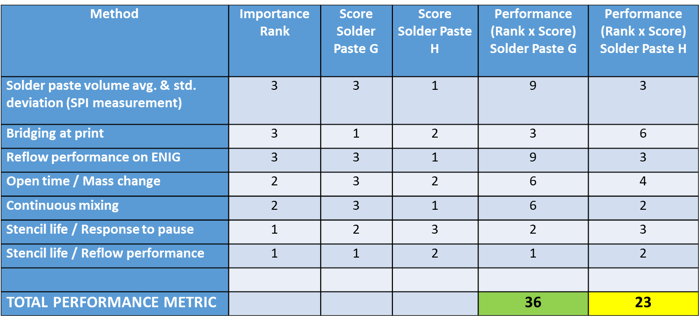
Figure 9: Solder Paste Weighted Scoring System
Quantitative data for each solder paste should be compared and contrasted. Weighting of the most important attributes can be done to help rate the pastes in terms of the most valuable qualities.
Finally, a score can be assigned to each solder paste by adding the weighted performance score for each test method.
The highest scoring solder pastes should be considered for use (Figure 9).